Resources
With the mission of providing an exceptional experience, we have developed fundamental features to offer a comprehensive understanding of your website's performance in real-world usage scenarios by your users.
Throughout the loading process of your site, various steps are carefully monitored to ensure detailed understanding.
Loading Performance
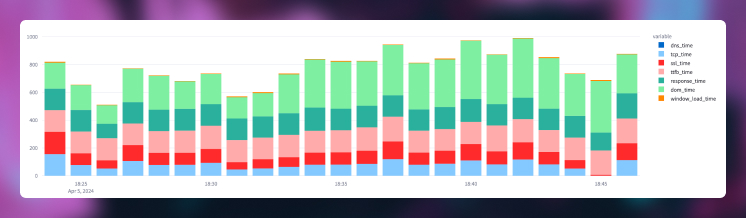
Visualize all metrics related to page loading layers.
Redirection
HTTP redirection time before the page loading starts, considering only same-origin redirections.
DNS
Domain lookup runtime.
TCP
Time required to establish the connection from the browser to the server.
SSL/TLS
Time to establish the transport connection, SSL handshake, and SOCKS authentication if TCP connection is made via HTTPS.
TTFB (Time to First Byte)
Interval between the browser request and receiving the first byte of response from the server.
Response Time
Time required to receive all response bytes from the server.
DOM
Time taken by the browser to construct the DOM tree.
Page Load
Time users wait until the page is fully available and interactive, including resources loaded after DOM processing.
Filtering by Features
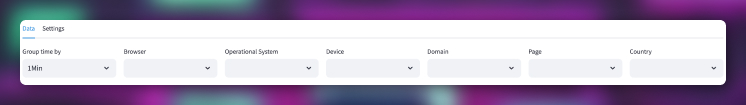
- Browser
- Operating System
- Device Type
- Smartphone
- Tablet
- Mobile Device
- Domains and Pages
- User Country (based on IP)
Core Web Vitals Data
Core Web Vitals consist of a set of metrics that assess practical user experience regarding page loading speed, interaction capability, and visual stability.
First Paint (FP)
Time interval between navigation and when the browser renders pixels for the first time on the screen.
First Contentful Paint (FCP)
Metric marking the initial point when the user sees any content on the screen.
First Input Delay (FID)
Time between the user's initial interaction with a page and the browser processing that interaction.
Cumulative Layout Shift (CLS)
Metric quantifying unexpected layout changes users might encounter.
Largest Contentful Paint (LCP)
Time needed to load the largest visible element when the user first opens the page.
Used Memory (usedJSHeapSize)
Metric representing the amount of JavaScript memory currently used by the browser.
Network
Monitor network usage on your pages.
- content_transfer_size (transferSize): Total size in bytes of HTTP responses and resources fetched during navigation.
- content_decoded_size (decodedBodySize): Size in bytes of the HTTP response body after being decoded.
- content_encoded_ratio: Expresses the content compression efficiency of a web page.
Simple Installation
We value simplicity in user experience, and this extends to installation.
To start using RUM, simply add a straightforward script to your site, and data collection will begin immediately, with no need for additional configuration.
You can embed the script directly into your site's HTML or through a tag manager like Google Tag Manager.
<script>
    window.addEventListener('load', function (event) {
        window.inlog_project_id = '50cd03602_demo_6e6ec4c3885';
        var scriptElement = document.createElement('script');
        scriptElement.defer = true;
        scriptElement.type = 'module';
        scriptElement.src = 'https://cdn.jsdelivr.net/gh/InApplet/InLog-rum-js@main/site/public/builds/inlog-rum.build.js';
        document.body.appendChild(scriptElement);
    });
</script>
Ready to get started?
Get in touch to find out more about our products. Contact us